The below map shows where we rode today with the mule along with an elevation profile of that ride. Today's track is in burgundy. The green track shows yesterday's ride and the bright red box shows where the obvious CO2 seepage is. Essentially we parked where the Ruby Ranch Road intersects the Salt Wash, set up our gear, and went on a practice ride from there.
The practice ride was 4.22 miles. We covered that in about 2 hours, which makes for a typical walking pace of just over 2 mph. This is somewhat slow for the ground we would like to cover, but during this ride we stopped several times to check out the data, try out various configurations with the inlet tubing, and investigate the source of somewhat unexpected rapid fluctuations in the absolute CO2 concentration (see below). We also underwent a lot of elevation gain and loss, and this is something that we will also not be doing during surveying days. William led today, and I essentially asked that he take us through distinctly different types of terrain, including bushes and some steep stuff, to test if it made any impact on the measurements. Survey days will be broken up into blocks in which we cover a relatively flat area in a bench or valley, move up or down to a neighboring bench or valley, survey, and move on again.

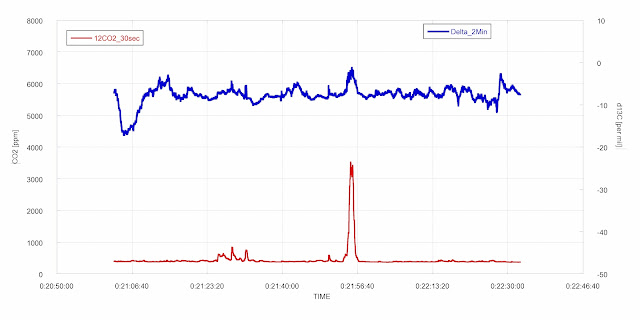
Here is a look at the data that we collected on this ride. The graph shows the CO2 concentrations [ppm] in red and with the y-axis on the left. Corresponding Delta 13-C signatures [per mil] are shown in blue with the y-axis on the right.
The CO2 concentrations fluctuate from 370 ppm to about 480 ppm, with a handful of isolated points breaching that. This is a much wider range than we were expecting. For some comparison, in Montana, surveying areas in an alfalfa field away from areas of CO2 leakage, CO2 concentrations ranged from 373-376 ppm. The isotopic signature is noisy because of the rate of fluctuation of the CO2 concentration, but on average has a value of exactly what we would expect from atmospheric CO2: -8.
We have two other piece to this puzzle: (1) when the mule was standing still, the CO2 concentrations are relatively flat; Essentially every place in the below graph that has a flat concentration is a time when the mule was standing still. (2) While nearly all the data was taken with the tube inlet attached to the mule's ankle, the last 10 minutes of data are taken with the sample inlet sticking up out of the machine above the mule.
There are several potential causes for this data: (1) The fluctuation is natural from background sources, either large volumes of CO2 are exhausting from soil gas (it was a cloudy day), or from prevalent CO2 leakage in the area (2) There is some noise introduced into the instrumentation as a result of it shaking while the animal is moving (3) Animals breathing are polluting the signal.
Chris of Picarro explained that vibrations will introduce random error in the concentration measurement through perturbations to the pressure of the measurement chamber in the instrument. The error introduced follows the law:
deltaC/C = 1/6*deltaP/P. Below is a graph of the CO2 concentration and the pressure in the chamber (in torr) on the same time axis:
It is clear that there are pressure perturbations due to the movement of the animal, but they are quite small. The standard deviation of the pressure in the chamber around the targeted 140 torr is 0.4 torr during the times when the mule is moving. For comparison, the standard deviation around the target pressure during our survey in Montana was about 0.2 torr. This would correspond to a few ppm at most error in the concentration measurement, not the 20-100 ppm that is fairly frequent the above data. In addition, the concentration fluctuation is always in the positive direction, while the pressure perturbations are evenly distributed around the mean and would result in both positive and negative error in the concentration measurement.
That the concentrations are fairly uniform when we are standing still seems to rule out natural background fluxes, and so right now I think that animals breathing is the strongest candidate. We can test this tomorrow, checking to see what the isotopic signatures is of the animal breath, and also attempting to snorkel the sampling tube well away from the animals. At this point, suggestions and feedback are more than welcome.
Tomorrow's survey will focus on the areas of obvious CO2 seepage (the boxed red area in the above image), and so we will also observe what a leakage signal looks like in these measurements.


