I'll be brief - Today we filled in a bit of the area that we had missed on the previous days, in addition to getting some detailed measurements directly over the bubbling CO2 springs. Below is the updated track map, followed by the measured CO2 concentration map

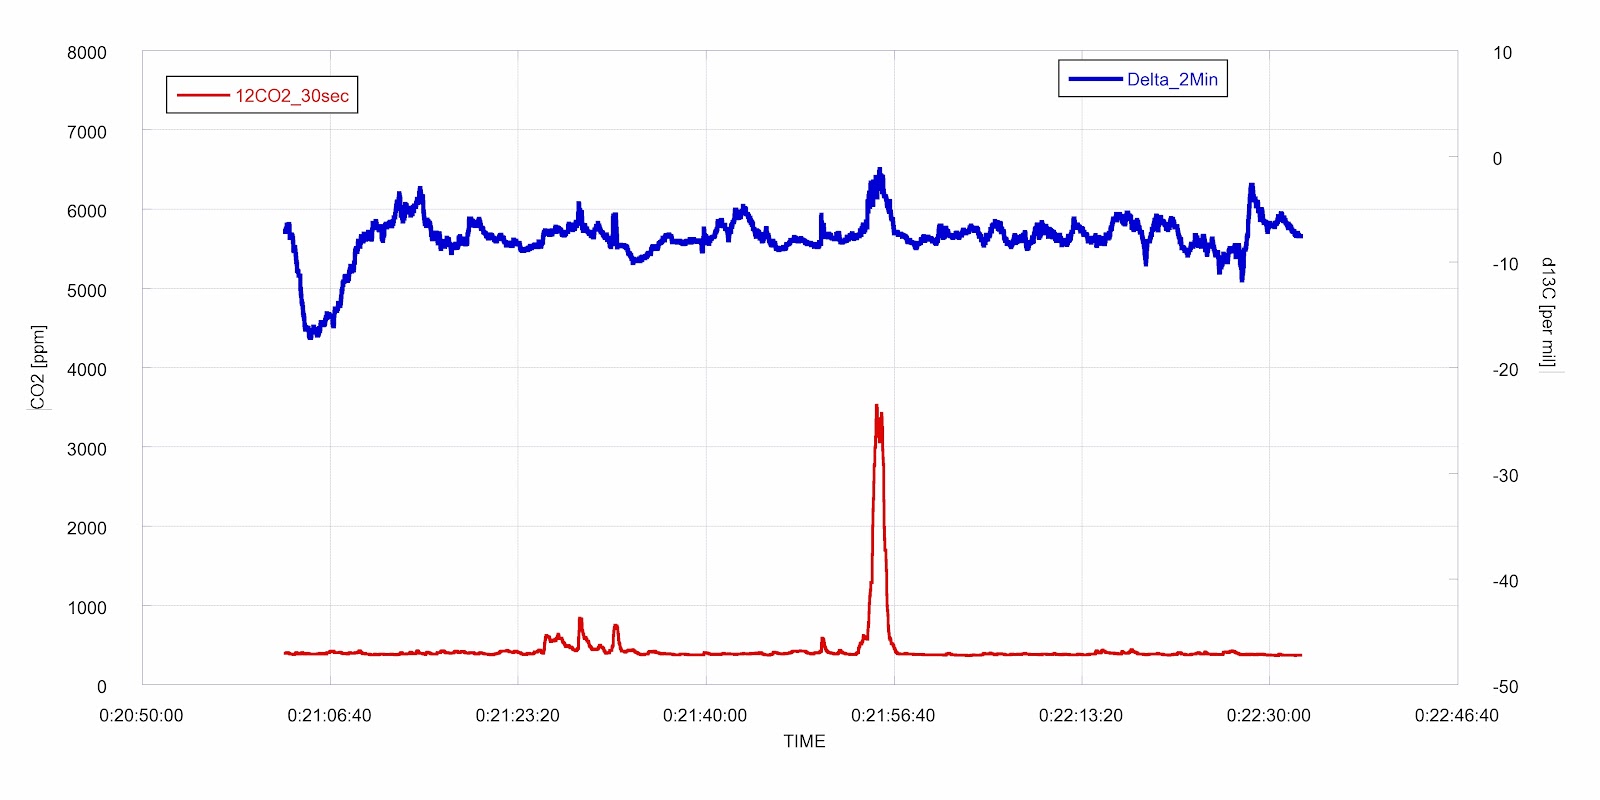
You can see 5 hot spots, which are essentially the springs area covered in one of the traverses. The CO2 and d13C time series profiles for the traverse that covered those areas is shown below. Clearly, we are now getting the kind of data that we have been looking for.
I haven't gone too far into the interpretation, but the CO2 concentration increase seems to correspond with an increase in the isotopic signature of the gas. The increase is fairly modest for the given concentration increases, and past studies have found that the d13C of exsolving gas has a value of -6, just positive of atmospheric. So in a sense, this is what we would expect. We will have to do a lot more processing and analysis back home to put some quantitative analysis to this.
Tomorrow is likely our final day of surveying and the goal is to do a high resolution measurements over the springs area and pin down exactly over how much area the leaking CO2 can be detected.


hi son. i've enjoyed following your blog. thanks. good job surmounting the numerous hurdles to getting good data. please, do make sure you get a good picture of yourself in the saddle. we're looking forward to having you back in ca. be safe. love, dad
ReplyDeleteThanks Dad! I'll be back this weekend.
ReplyDelete